 |
 |
| (a) | (b) |
keywords: image processing, image analysis, light microscopy, digital measurement theory, calibration
Abstract
The use of a light microscope for the quantitative analysis of specimens requires an understanding of: light sources, the interaction of light with the desired specimen, the characteristics of modern microscope optics, the characteristics of modern electro-optical sensors (in particular, CCD cameras), and the proper use of algorithms for the restoration, segmentation, and analysis of digital images. All of these components are necessary if one is to achieve the accurate measurement of "analog" quantities given a digital representation of an image. In this paper we will explore several of these issues in detail as they provide important insights into the entire process and their importance is frequently underestimated by practitioners.
Introduction
While light microscopy is almost 400 years old [1,2], the developments of the past decade have offered a variety of new mechanisms for examining biological and material samples. In this past decade we have seen the development and/or exploitation of techniques such as confocal microscopy, scanning near field microscopy, standing wave microscopy, fluorescence lifetime microscopy, and two-photon microscopy. (See, for example, recent issues of Bioimaging and Journal of Microscopy.) In biology the advances in molecular biology and biochemistry have made it possible to selectively tag (and thus make visible) specific parts of cells such as actin molecules or sequences of DNA of 1000 base pairs or longer. In sensor technology modern CCD cameras are capable of achieving high spatial resolution and high sensitivity measurements of signals in the optical microscope. In computer processing we have learned how to process digitized images so as to extract meaningful measurements of "analog" quantities given digital data.
The applications that motivate and exploit these developments can be divided into those in which the goal is the production of images that are to be used as images by human observers and those where the images are to analyzed to produce data for human interpretation. In the former case where we can speak of specimen in -> image out the issue is image processing; in the latter case where we can speak of specimen in -> data out, the issue is image analysis. As we hope to demonstrate in this paper, the two different applications processing and analysis can lead to different sets of conclusions in the choice of algorithms and technical constraints such as sampling frequency.
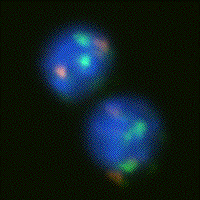
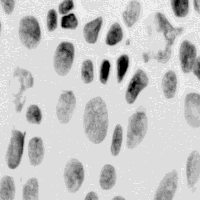
In the case of image analysis we can also make a clear distinction between problems of detection and problems of estimation. An example of a detection problem might be finding the spots produced in a cell nucleus by molecular probes that are specific for the DNA on either chromosome number 1 or chromosome number 7. Using fluorescent dyes to color chromosome 1 green and chromosome 7 orange-red and to color the entire DNA content blue (see Figure 1a) the central problem becomes the detection of the colored dots followed by simple counting. As a second example we consider the measurement of the amount of DNA in each cell in order to build a profile of the DNA distribution in a population of cells. In Figure 1b we see cell nuclei that have been stained with a quantitative (stoichiometric) staining reagent (Feulgen) and where the amount of stain per pixel is proportional to the DNA content per pixel.
 |
 |
| (a) | (b) |
Figure 1: (a) Human lymphocytes stained with fluorescent dyes DAPI (blue), Spectrum Green, and Spectrum Orange to reveal total DNA content, the centromeric DNA of chromosome 1, and the centromeric DNA of chromosome 7, respectively. (b) Human tissue sampled stained with the absorptive dye Feulgen that is quantitative for DNA content. The optical density per pixel is proportional to the DNA content per pixel.
Waves and Photons
Modern physics has taught us that there are two, inter-related ways of describing light - as waves and as a collection of massless particles, photons. Both of these descriptions are necessary in order to understand the properties and limitations of quantitative microscopy.
Waves - The wave description leads naturally to a consideration of the
wavelength of light being used,  , and the diffraction limits of modern
microscope lenses. A modern well-designed, aberration "free"
microscope lens may be characterized as an LSI system with a point spread
function (PSF) followed by a pure magnification system as shown in Figure
2 [3].
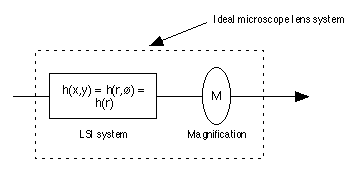 |
Figure 2: An "ideal" microscope lens has a point spread
function that is circularly symmetric h(r). This is followed by a magnification
factor M. Typical vales of M are 25x, 40x, and 63x. Note
that the total lens system is not shift invariant (SI) because moving the
input image (in space) by a distance  x will cause the output image to
move by M
 x instead of
  x.
x.
The form of the PSF is circularly symmetric and given by:
 |
(1) |
where J1(•) is a Bessel function of the
first kind. We see that
for this ideal case only two parameters are of consequence - the
wavelength
of light  and the numerical aperture of
the lens NA. The NA of the lens
measures the ability of the lens to collect light and is given by
n•sin(
 )
with n the index of refraction of the medium between the lens and
the specimen
and
  the angle of acceptance of the
microscope lens. Typical values of
n are 1.0 (air), 1.3 (water), and 1.5 (immersion oil). A maximum
value
for
  is about 69°. This leads to values of NA that are less than
1.0 in air and less than 1.4 in oil.
The optical transfer function (OTF) of an ideal, circularly-symmetric
microscope lens can be calculated. Because of the circular symmetry,
H( x,
x, y)
= F{h(x,y)} = F{h(r)} = H(
 r) where F{•} is the Fourier transform operation.
The OTF is given by:
 |
(2) |
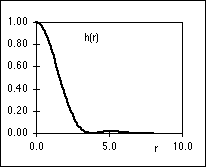
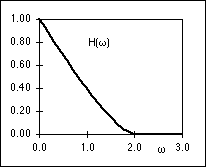
The PSF, h(r), and the OTF, H( r), are shown in Figure 3. It is the
PSF that gives rise to the well-known Airy disk [4].
 |
 |
| (a) | (b) |
Figure 3: (a) PSF, h(r), of an ideal microscope lens. (b)
OTF,
H( r), of the ideal microscope lens. Both
are evaluated for a = 1 in equations
1 and 2.
An important feature of the OTF is that it is bandlimited. That is,
there exists a frequency  c such that
H(
 c) = 0 for |
 | >
| >  c.
This cutoff frequency is given by:
 |
(3) |
For green light with a wavelength of 500 nm. and using an
oil-immersion
lens with NA = 1.4, this corresponds to a cutoff frequency of 5.6 cycles
per µm (microns). The Nyquist sampling theorem would then imply
that
an image to be analyzed after sampling would require a minimum sampling
frequency of 2 c. In this
example this implies 11.2 samples per micron
or a maximum distance of 0.089 microns between samples. While this very
fine sampling might appear to be "overkill", we should
remember
that biological samples do contain arbitrarily small physical details
and
thus the Fourier spectrum is not limited by the input physical signal
(the
specimen) but rather by the diffraction limits of the microscope
objective
(a low-pass filter). As a practical consequence, the examination of a
small
human metaphase chromosome which is only about 1 micron by 2 microns
leads
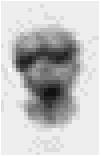
to a digital image of only 15 by 30 pixels as shown in Figure 4.
 |
 |
 |
| (a) | (b) |
Figure 4: (a) Small metaphase chromosome stained with the absorptive dye Giemsa in order to reveal the band structure. (b) A 4x enlargement reveals the small number of pixels involved in the digital image representation.
Another direct consequence of the bandlimited nature of the
microscope
optics can be found in procedures for autofocusing as well as for
understanding
the issue of depth-of-focus. When an image specimen with Fourier
spectrum
I( x,
x, y) is passed through a microscope with an OTF given
by H(
 x,
x, y) this
produces an output image O(
 x,
x, y) = I(
 x,
x, y)•H(
y)•H( x,
x, y). The act of
focusing or defocusing the microscope does not change the spectrum of
the
specimen but rather the OTF. In other words the OTF is a function of the
z-axis position of the microscope. We can make this explicit by writing
H(
 x,
x, y,
y,  z). A typical example of this dependency is shown in Figure
5.
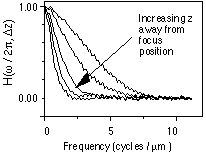 |
Figure 5: As we move away from optimum focus, as  z increases,
the H(
 r) "sags".
These measured data describe a 60x
lens with an NA of 1.4 (oil-immersion), and a wavelength of
  = 400 nm
(blue). The cutoff frequency fc (from equation 3) should be
7.0 cycles
per µm.
It is clear that independent of the focus H( =0,
=0,  z) = 1.0; all the
light that enters the microscope through the objective lens is assumed
to leave the microscope through the ocular or camera lens. At the
bandlimit
of the lens, the amplitude of H(
 =
= c,
c,  z)
= 0.0, again
independent
of focus. Thus autofocus algorithms can only expect to work well when
they
examine midband frequencies around
  r
/ 2a = 0.75 (as seen in Figure 3b)
and when the input signal spectrum I(
 x,
x, y) contains a sufficient amount
of energy in that spectral band. A complete analysis of this can be
found
in [5].
Further, the depth-of-focus - that distance  z over which the image
specimen can be expected to be observed without significant optical
aberration
- can be derived from considerations of wave optics and shown to be [6,
7]:
 |
(4) |
Again using the typical values of  = 500 nm, NA = 1.4, and n = 1.5,
we arrive at a depth-of-focus of
  z = 0.13 µm, a very thin region
of critical focus.
Photons - A second and equally important aspect of the
physical signal
that we observe is the quantum nature of light. Assuming for the moment
an ideal situation, a single photon that arrives at a single CCD camera
pixel may have been transmitted through a specimen (as in absorptive
microscopy)
or may been emitted by a fluorescent dye molecule. In either case that
single photon for  = 500 nm will carry an
energy of E = h
 = hc/
= hc/ = 3.97 x 10⁻¹⁹ Joules. While this is a seemingly infinitesimal amount of
energy, modern CCD cameras are sensitive enough to be able to count
individual
photons. The real problem arises, however, from the fundamentally
statistical
nature of photon production. We cannot assume that in a given pixel for
two consecutive but independent observation intervals of length T that
the same number of photons will be counted. Photon production is
governed
by the laws of quantum physics which restrict us to talking about an
average
number of photons within a given observation window. The probability
distribution
of photons in an observation window of length T seconds is known to be
Poisson. [8]. That is, the probability of p photons in an interval of
length
T is given by:
 |
(5) |
where  is the rate or intensity
parameter measured in photons per second.
It is critical to understand that, even if there were no other noise
sources
in the imaging chain, the statistical fluctuations associated with
photon
counting over a finite time interval T would still lead to a finite
signal-to-noise
ratio (SNR). If we express this SNR as 20 log�10(
 ), then due to
the fact that the average value of a Poisson process is given by µ
=
  and the standard deviation is given by
 , we have that SNR = 10 log�10(
 ).
).
 |
 |
| (a) | (b) |
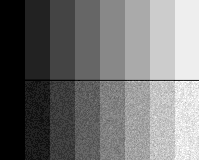
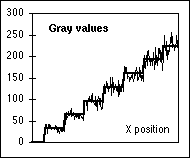
Figure 6: (a) Top: Gray level step wedge with 8 levels.
Bottom:
The same step wedge as if each pixel were contaminated with Poisson
noise
and the rate parameter  was the
original pixel value (with T=1 in eq.
5). (b) Two curves: the heavy curve shows a horizontal line through the
uncontaminated step wedge; the thin line shows the result of the Poisson
noise contamination.
In this context it is important to understand that the three traditional assumptions about the relationship between signal and noise do not hold:
Techniques that have been developed to deal with noisy images under the traditional assumptions - techniques for enhancement, restoration, segmentation, and measurement - must be reexamined before they can be used with these types of images.
Camera Evaluation
Thinking in terms of photons has a direct effect
on the evaluation of alternative camera systems for quantitative
microscopy.
When a photon strikes the photosensitive surface of a CCD, it may or may
not cause a photoelectron to be collected in the potential well. The
probability
of this happening is associated with the quantum efficiency of the
material
(usually silicon) and the energy (wavelength) of the photon. Typical
values
for the quantum efficiency for silicon are around 50%, increasing
towards
the infra-red and decreasing towards the blue end of the spectrum. But
each photoelectron that is produced comes from one photon so that
photoelectrons
(as well as photons) have a Poisson distribution. If a CCD well has a
finite
capacity for photoelectrons, C, then the maximum possible signal will be
C and the standard deviation will be  . This means that the maximum SNR
per pixel will be limited to SNR�max = 10
log�10(C). Thus even if all other
sources of noise are negligible compared to the fundamental fluctuations
in the photon counts, the SNR will be limited by the CCD well capacity.
If we choose to perform on-chip integration after the well is full then
we will only achieve blooming - the leaking of the overfull well into
other
nearby wells. For three, well-known CCD chips these limits are given in
Table 1.
| Chip
Manufacturer |
Pixel Size µm�2 |
Capacity photoelectrons |
SNRmax dB |
|---|---|---|---|
| Kodak KAF 1400 |
6.8 x 6.8 |
32,000 |
45 |
| Sony PA-93 |
11.0 x 11.0 |
80,000 |
49 |
| Thompson TH 7882 |
23.0 x 23.0 |
400,000 |
56 |
Table 1: Characteristics per pixel of some well-known CCD chips.
Each of these chips when integrated into a well-designed camera is capable of achieving these theoretical, maximum SNR values [9]. The invariant among these three chips is the photoelectron capacity per square micron. If we think of the well as having a volume given by the cross-sectional area times the depth, then the capacity per unit cross-sectional area for all three chips is about 700 photoelectrons/µm�2.
The verification that the SNR is photon-limited can be achieved by looking at the form of SNR(C) versus C. When the form is log(C) and the asymptotic value is that given in Table 1, then we can be confident that we are dealing with a well-designed camera that is, in fact, limited only by photon noise. An example of this type of result for a Photometrics CC200 camera based on the Kodak KAF 1400 chip is given in Figure 7.
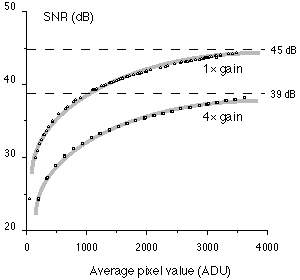 |
Figure 7: : SNR as a function of the recorded image brightness for a cooled Photometrics KAF 1400 camera. The data were collected in both the 1x and 4x gain modes. The data follow a log(•) function (shown in a thick gray line) up to the maximum well capacity of the CCD photoelement.
Using the Poisson model it is also possible to determine the
sensitivity
of each camera. There is clearly a scale factor (G) between
photoelectrons
(e- ) and ADU. (An ADU is the step size of the A/D converter.
That is, the difference between gray level k and k+1.) Thus the output y (in ADU) and
the input x (in photoelectrons) are related by y = G•x. It holds for
any random variable that E{y} = E{G•x} = G•E{x} and
V{y} = V{G•x}
= G2•V{x} where E{•} and V{•} are the expectation and
variance
operators, respectively. Using the additional constraint that x has a
Poisson
distribution gives E{y} = G•E{x} = G• and V{y} = G2•V{x}=
G2•
 . This means that an estimate of the scale factor is given by
V{y}
/ E{y} = G independent of
  . The sensitivity S is simply 1/G. The
sensitivity
for the three chips mentioned above and in specific camera
configurations
is given in Table 2.
| Camera/Chip |
Sensitivity e- / ADU |
Dark Current ADU / s |
Temperature °C |
|---|---|---|---|
| Photometrics / KAF 1400 | 7.9 | .002 | -42 |
| Sony XC-77RRCE / PA-93 | 256.4 | .043 | +22 |
| Photometrics / TH 7882 | 90.9 | .420 | -37 |
Table 2: Characteristics per pixel of some well-known cameras. Both of the Photometrics camera are cooled using Peltier elements. Both were evaluated in the 1x gain setting. The Sony camera is being used in integration mode with integration times on the order of 3 to 4 seconds. (See [9].)
The extraordinary sensitivity of modern CCD cameras is clear from these data. In the 1x gain mode of the Photometrics KAF 1400 camera, only 8 photoelectrons (approximately 16 photons) separate two gray levels in the digital representation of the image. For the considerably less expensive Sony camera only about 500 photons separate two gray levels.
There are, of course, other possible sources of noise. Specifically:
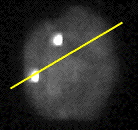
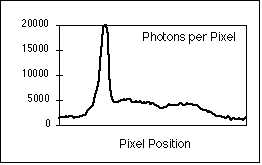
All of this is of more than of academic interest when we consider the strength of signals that are encountered in fluorescence microscopy. An example is shown in Figure 8 [10].
 |
 |
| (a) | (b) |
Figure 8: (a) Interphase nucleus stained for both general DNA (gray) and centromeric DNA (white dots). Exposure time was 4 seconds with a Photometrics KAF 1400 camera. (b) Number of photons per pixel along the yellow line in (a).
Sampling Density
There are other sources of noise in a digital image besides noise contamination of the pixel brightness. The act of sampling - cutting up the image into rows and columns in 2D and rows, columns, and planes in 3D - is also an important source of noise which is of particular significance when the goal is image analysis. The potential effect of this kind of noise can be illustrated with the relatively simple problem of measuring the area of a two dimensional object such as cell nucleus. It has been known for many years [11] that the best measure of the area of an "analog" object given its digital representation is to simply count the pixels associated with the object. The use of the term "best estimate" means that the estimate is unbiased (accurate) and that the variance goes to zero (precise) as the sampling density increases. We assume here that the pixels belonging to the object have been labeled thus producing a binary representation of the object. The issue of using the actual gray values of the object pixels to estimate the object area will not be covered here but can be found in [12, 13].
To illustrate the issue let us look at a simple example. When a randomly placed (circular) cell is digitized, one possible realization is shown in Figure 9. The equation for generating the "cell" is where R is the radius of the cell. The terms ex and ey are independent random variables with a uniform distribution over the interval (-1/2, +1/2). They represent the random placement of the cell with respect to the periodic (unit) sampling grid.
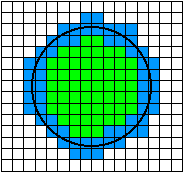 |
Figure 9: Given small variations in the center position (ex, ey) of the circle, pixels that are colored green will always remain part of the object and pixels that are colored white will always remain part of the background. Pixels that are shown in blue may change from object to background or vice-versa depending on the specific realization of the circle center (ex, ey) with respect to the digitizing grid.
In the realization shown in Figure 9 the area would be estimated at
84 pixels but a slight shift of the circle with respect to the grid
could
change that, for example, to 81 or 83 or 86. The sampling density of
this
figure can be expressed as about 10 pixels per diameter. To appreciate
what effect the finite sampling density has on the area estimate let us
look at the coefficient-of-variation of the estimate, the CV =  where
where  is the standard deviation of the estimate
of the area and µ is the average
estimate over an ensemble of realizations.
If we denote the diameter of the cell by D and the size of a pixel as s x s, then the sampling density is Q = D/s. The total area of the circle, A1, that is always green (in Figure 9) independent of (ex, ey) is given by:
 |
(6) |
The number of pixels associated with this is:
 |
(7) |
The total area of the region, Ab, that is blue (in Figure 9) is given by:
 |
(8) |
and the number of pixels, Nb, associated with this region is:
 |
(9) |
The area of the circle is estimated by counting pixels and the contribution from the green region is clearly N1. The total number will be NT = N1 + n where n is a random variable. Let us make a simplifying assumption: Let us assume that each of the pixels in the blue region can be part of the object with probability p and part of the background with probability (1 - p) and that the decision for each pixel is independent of the other neighboring pixels in the blue region. This, of course, describes a binomial distribution for the pixels in that region. In fact this assumption is not true and the behavior of neighboring pixels is somewhat correlated. But let us see how far we can go with this model. Under this assumption:
 |
(10) |
and
 |
(11) |
We have made use of the assumption that N1 is deterministic - the pixels are always green - and that the mean and variance of the binomial distribution for Nb samples with probability p are given by Nb p and Nb p(1 - p), respectively.
This immediately leads to an expression for the CV of our estimate as:
 |
(12) |
We can now study the convergence of the CV as the sampling density increases. As Q increases in this two-dimensional image we have:
 |
(13) |
This type of argument can easily be extended to the three-dimensional case where the results are:
 |
(14) |
and
 |
(15) |
Finally, for the N-dimensional case we have:
 |
(16) |
The conclusion is clear. As the sampling density Q increases the precision of our estimates improve as a power of Q. While the independent binomial behavior cannot be strictly true, the arguments presented do show the type of convergence that can be expected and how that varies with Q. These results have also been found experimentally in a number of publications [11-17]. An example in shown in Figure 10. The measurement is the volume of spheres that have been randomly placed on a sampling grid. The quality of the estimator (voxel counting) is assessed by examining the CV.
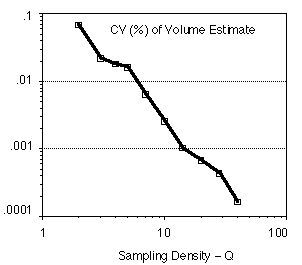 |
Figure 10: For each sampling density value Q (expressed
in voxels
per diameter), 16 spheres were generated with randomly placed centers
(ex,
ey, ez). The volume was measured by counting
voxels and the CV(Q) =  (Q) / µ(Q)
calculated accordingly.
It is clear from Figure 10 that as the sampling density increases by one order of magnitude from Q=2 to Q=20 samples per diameter that the CV decreases by two orders of magnitude. This illustrates the relation between CV and Q shown in equation 15.
Choosing Sampling Density - We are now presented with an interesting
conundrum. Let us say we wish to measure the area of red blood cells. Their
individual diameters are on the order of 8.5 µm [18]. If we use a
lens with NA = 0.75 and blue illumination with  = 420 nm (near the absorption
peak of hemoglobin), then according to equation 3 and the Nyquist theorem,
a sampling frequency of fs > 2 • fc = 7.2 samples per µm should
be sufficient. This will give around 60 samples per diameter which according
to published results [14] should lead to more than enough precision for
biological work, that is, a CV below the 1% level. If, however, a small
chromosome as in Figure 4 is sampled with the same lens then the approximate
sampling density per chromosome "diameter" will be about 10 pixels
and the CV above the 1% level.
The question then becomes should we choose the sampling density on the basis of the Nyquist sampling theorem or on the basis of the required measurement precision. The answer lies in the goal of the work. If we are interested in autofocusing or depth-of-focus or image restoration then the Nyquist theorem should be used. If, however, we are interested in measurements derived from microscope images then the sampling frequencies derived from measurement specifications (as exemplified in Figure 10 and equations 13, 15, and 16) should be used.
Calibration
Finally, we come to the issue of using independent test objects and images to calibrate systems for quantitative microscopy. In this section we will describe procedures for calculating the actual sampling density as well as the effective CV for specific measurements in a quantitative microscope system.
Sampling Density - A commercially prepared slide with a test pattern
(a stage micrometer or a resolution test chart) is, in general,
necessary
to determine the sampling densities  x and
x and  y in a microscope system and
to test whether the system has square pixels, that is, if
  x =
x =  y. An example
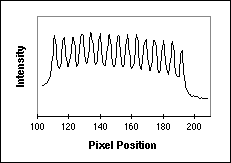
of a digitized image of a test pattern is shown in Figure 11a and a
horizontal
line through a part of the image is shown in Figure 11b. The image comes
from a resolution test chart produced by Optoline and taken in
fluorescence
with a 63x lens and an NA = 1.4.
 |
 |
| (a) | (b) |
Figure 11: (a) Fluorescence test pattern that can be used to measure the sampling density. The yellow line goes through a series of bars that are known to have a 2 µm center-to-center spacing (500 lp / mm). (b) The intensity profile along the yellow line indicated on the left.
Using a simple algorithm we can process the data in Figure 11b to determine
that, averaged over 14 bars in the pattern, the sampling distance  x =
2.9 samples / µm. By turning the test pattern 90° the sampling
distance
  y can be measured. Further, this test pattern can be used to
compute the OTF [3, 19].
System performance - All measurement systems require standards for calibration and quantitative microscopes are no exception. A useful standard is prepared samples of latex microspheres. They can be stained with various fluorescent dyes and they can also be used in absorption mode. An image of one such microsphere is shown in Figure 12.
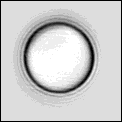 |
Figure 12: Fluorescently-labeled latex microsphere observed in absorption mode with a Nikon Optiphot microscope and Nikon PlanApo 60x, NA=1.40 lens and digitized with a Cohu 4810 CCD camera and a Data Translation QuickCapture frame grabber. The beads were from Flow Cytometry Standards Corp.
The sphere shown in Figure 12 comes from a population that is characterized by the manufacturer as having an average diameter of 5.8 µm and a CV of 2%. We can, therefore, use a population of these spheres to calibrate a quantitative system. When measuring a population for a specific property (such as diameter), we can expect a variation from sphere to sphere. The variation can be attributed to the basic instrumentation (such as electronic camera noise), the experimental procedure (such as focusing), and the "natural" variability of the microspheres. Each of these terms is independent of the others and the total variability can therefore be written as:
 |
(17) |
For a given average value of the desired property we have:
 |
(18) |
Through a proper sequence of experiments it is possible for us to assess the contribution of each of these terms to the total CV. This total value will then reflect the contributions from both of the effects described in detail above - the various noise sources (quantum, thermal, electronic) as well as the effect of the finite spatial sampling density.
As an example let us say that we wish to examine the CV associated with the measurement of the diameter of the microspheres. The diameter of these spheres can be estimated from the two-dimensional projected area of the spheres according to the estimator:
 |
(19) |
We start with a single sphere placed in the center of the microscope
field-of-view and critically focused. An image is grabbed, corrected for
the deterministic variation of the background illumination, and then
segmented
to provide a collection of labeled object pixels . The area and derived
diameter are then determined. We then repeat this procedure without
moving
the sphere to acquire a total of N estimates of the diameter. For
this
protocol it is clear that  proc =
  spher = 0 and that only the variability
associated with the equipment (the various noise sources) will
contribute
to the total CV. When this technique was applied with N=20 microspheres
the result was CVtotal = CVequip = 0.1%. Note that
this value is better than one might expect on
the basis of the SNR per pixel because a number of pixels were involved
in determining the diameter estimate.
We now take the same microsphere and move it out of the
field-of-view
(in all three directions x, y, and z) and then back into the field at a
random position. This tests the variability associated with the sampling
grid as well as the effects of focusing while keeping  spher = 0. When
this procedure was repeated (N=20) the result was:
 |
(20) |
which means that CVproc = 0.31%.
We are now ready to measure the total CV by looking at a population of spheres. For N=185, the measured CVtotal = 1.41% which means that:
 |
(21) |
a value somewhat smaller than the manufacturer's specification. The results are summarized in Figure 13.
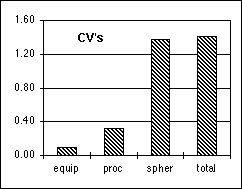 |
Figure 13: The various coefficients-of-variation, CV's, associated with the microsphere calibration protocols.
Summary
We have seen that modern CCD camera systems are limited by the fundamental quantum fluctuations of photons that cannot be eliminated by "better" design. Further, proper choice of the sampling density involves not only an understanding of classic linear system theory - the Nyquist theorem - but also the equally stringent requirements of digital measurement theory. Experimental procedures that rely on the CV can be used to evaluate the quality of our quantitative microscope systems and to identify which components are the "weakest link." Typical values of relatively straightforward parameters such as size can easily be measured to CV's around 1%.
Acknowledgments
This work was partially supported by the Netherlands Organization for Scientific Research (NWO) Grant 900-538-040, the Foundation for Technical Sciences (STW) Project 2987, and the Rolling Grants program of the Foundation for Fundamental Research in Matter (FOM).
References
[1] Purtle HR, History of the Microscope. Washington, DC: Armed Forces Institute of Pathology, 1974.
[2] Young IT, Balasubramanian, Dunbar DL, Peverini RL, and Bishop RP, "SSAM: Solid State Automated Microscope," IEEE Trans Biomed Eng, vol. BME-29: 70-82, 1982.
[3] Young IT, "Image Fidelity: Characterizing the Imaging Transfer Function," in Fluorescence Microscopy of Living Cells in Culture: Quantitative Fluorescence Microscopy - Imaging and Spectroscopy, vol. 30:B, Method in Cell Biology, D. L. Taylor and Y. L. Wang, Eds. San Diego: Academic Press, vol 30:1-45, 1989.
[4] Born M and Wolf E, Principles of Optics, Sixth ed. Oxford: Pergamon Press, 1980.
[5] Boddeke FR, Van Vliet LJ, Netten H, and Young IT, "Autofocusing in microscopy based on the OTF and sampling," Bioimaging, vol. 2:193-203, 1995.
[6] Young IT, Zagers R, Van Vliet LJ, Mullikin JC, Boddeke FR, and Netten H, "Depth-of-focus in microscopy," Proceedings of the 8th Scandinavian Conference on Image Analysis, Troms¿, Norway, Vol. 1:493-498, 1993.
[7] Reynolds GO, DeVelis JB, Parrent BGJ, and Thompson BJ, Physical optics notebook: Tutorials in Fourier optics. Bellingham, Washington: SPIE Optical Engineering Press, 1989.
[8] Marcuse D, Engineering Quantum Electrodynamics. New York: Harcourt, Brace & World, 1970.
[9] Mullikin JC, Van Vliet LJ, Netten H, Boddeke FR, Van der Feltz G, and Young IT, "Methods for CCD Camera Characterization," Proceedings of SPIE Conference on Image Acquisition and Scientific Imaging Systems, SPIE vol 2173:73-84, 1994.
[10] Netten H, Young IT, Prins M, Van Vliet LJ, Tanke H, Vrolijk H, and Sloos W, "Automation of Fluorescent Dot Counting in Cell Nuclei," Proceedings of 12th IAPR International Conference on Pattern Recognition, Jerusalem, Israel, IEEE Computer Society Press, pp. 84-87, 1994.
[11] Mat*rn B, "Precision of area estimation: a numerical study," Journal of Microscopy, vol. 153:269-284, 1989.
[12] Van Vliet LJ, "Grey-scale measurements in multi-dimensional digitized images," PhD Thesis, Delft University of Technology, 1993.
[13] Verbeek PW and Van Vliet LJ, "Estimators of 2D edge length and position, 3D surface area and position in sampled grey-valued images," BioImaging, vol. 1:47-61, 1993.
[14] Young IT, "Sampling density and quantitative microscopy," Analytical and Quantitative Cytology and Histology, vol. 10:269-275, 1988.
[15] Smeulders AWM and Dorst L, "Measurement issues in morphometry," Analytical and Quantitative Cytology and Histology, vol. 7:242-249, 1985.
[16] Mullikin JC, "Discrete and continuous methods for three-dimensional image analysis," PhD Thesis, Delft University of Technology, 1993.
[17] Mullikin JC and Verbeek PW, Surface area estimation of digitized planes, Bioimaging, vol. 1:6-16, 1993.
[18] Altman PL and Dittmer DS, Blood and Other Body Fluids. Bethesda, Maryland: Federation of American Societies for Experimental Biology, 1961.
[19] Young IT, "The Use of Digital Image Processing Techniques for the Calibration of Quantitative Microscopes," Proceedings of SPIE Conference on Applications of Digital Image Processing, SPIE vol 397:326-335, 1983.
[20] Castleman KR, Digital Image Processing. Englewood Cliffs, New Jersey: Prentice-Hall, 1979.
[21] Gonzalez RC and Woods RE, Digital Image Processing. Reading, Massachusetts: Addison-Wesley, 1992.
Biography
Ian T. Young was born in Chicago, Illinois in 1943. He received the BS, MSc, and PhD degrees, all in electrical engineering, from the Massachusetts Institute of Technology in 1965, 1966, and 1969, respectively. From 1969 to 1973 he was an Assistant Professor of Electrical Engineering and from 1973 to 1979 he was an Associate Professor of Electrical Engineering at MIT. From 1978 to 1981 he was a Group Leader for Pattern Recognition and Image Processing at the Biomedical Sciences Division of Lawrence Livermore National Laboratory, University of California, Livermore. In December 1981 he became a chaired Professor of Measurement Technology and Instrumentation Science in the Faculty of Applied Physics at the Delft University of Technology in The Netherlands. He has also been a Visiting Professor in the Faculty of Laboratory Medicine at the University of California San Francisco and in the Electrical Engineering departments of the Technical University Delft (The Netherlands), the Technical University Linksping (Sweden), the Ecole Polytechnique Federale de Lausanne (Switzerland), the Ecole des Mines de Paris (France), and the Technical University of Bandung (Indonesia). Dr. Young is on the editorial boards of a number of scientific journals, is a co-author of a standard textbook Signals and Systems, and is co-editor of the journal Bioimaging. Dr. Young makes an excellent hot-and-sour soup and an excellent bouillabaisse.
Revised: 8 February 1998